
The window
The window has a bar of controls at the top, a row of session tabs under it, and three panes: Structure on the left, Requests in the middle and the inspector on the right. The breakpoints open in a panel along the bottom. The composer, Scripts, Smart actions, Compare, Decoder and Settings each open in a window of their own.
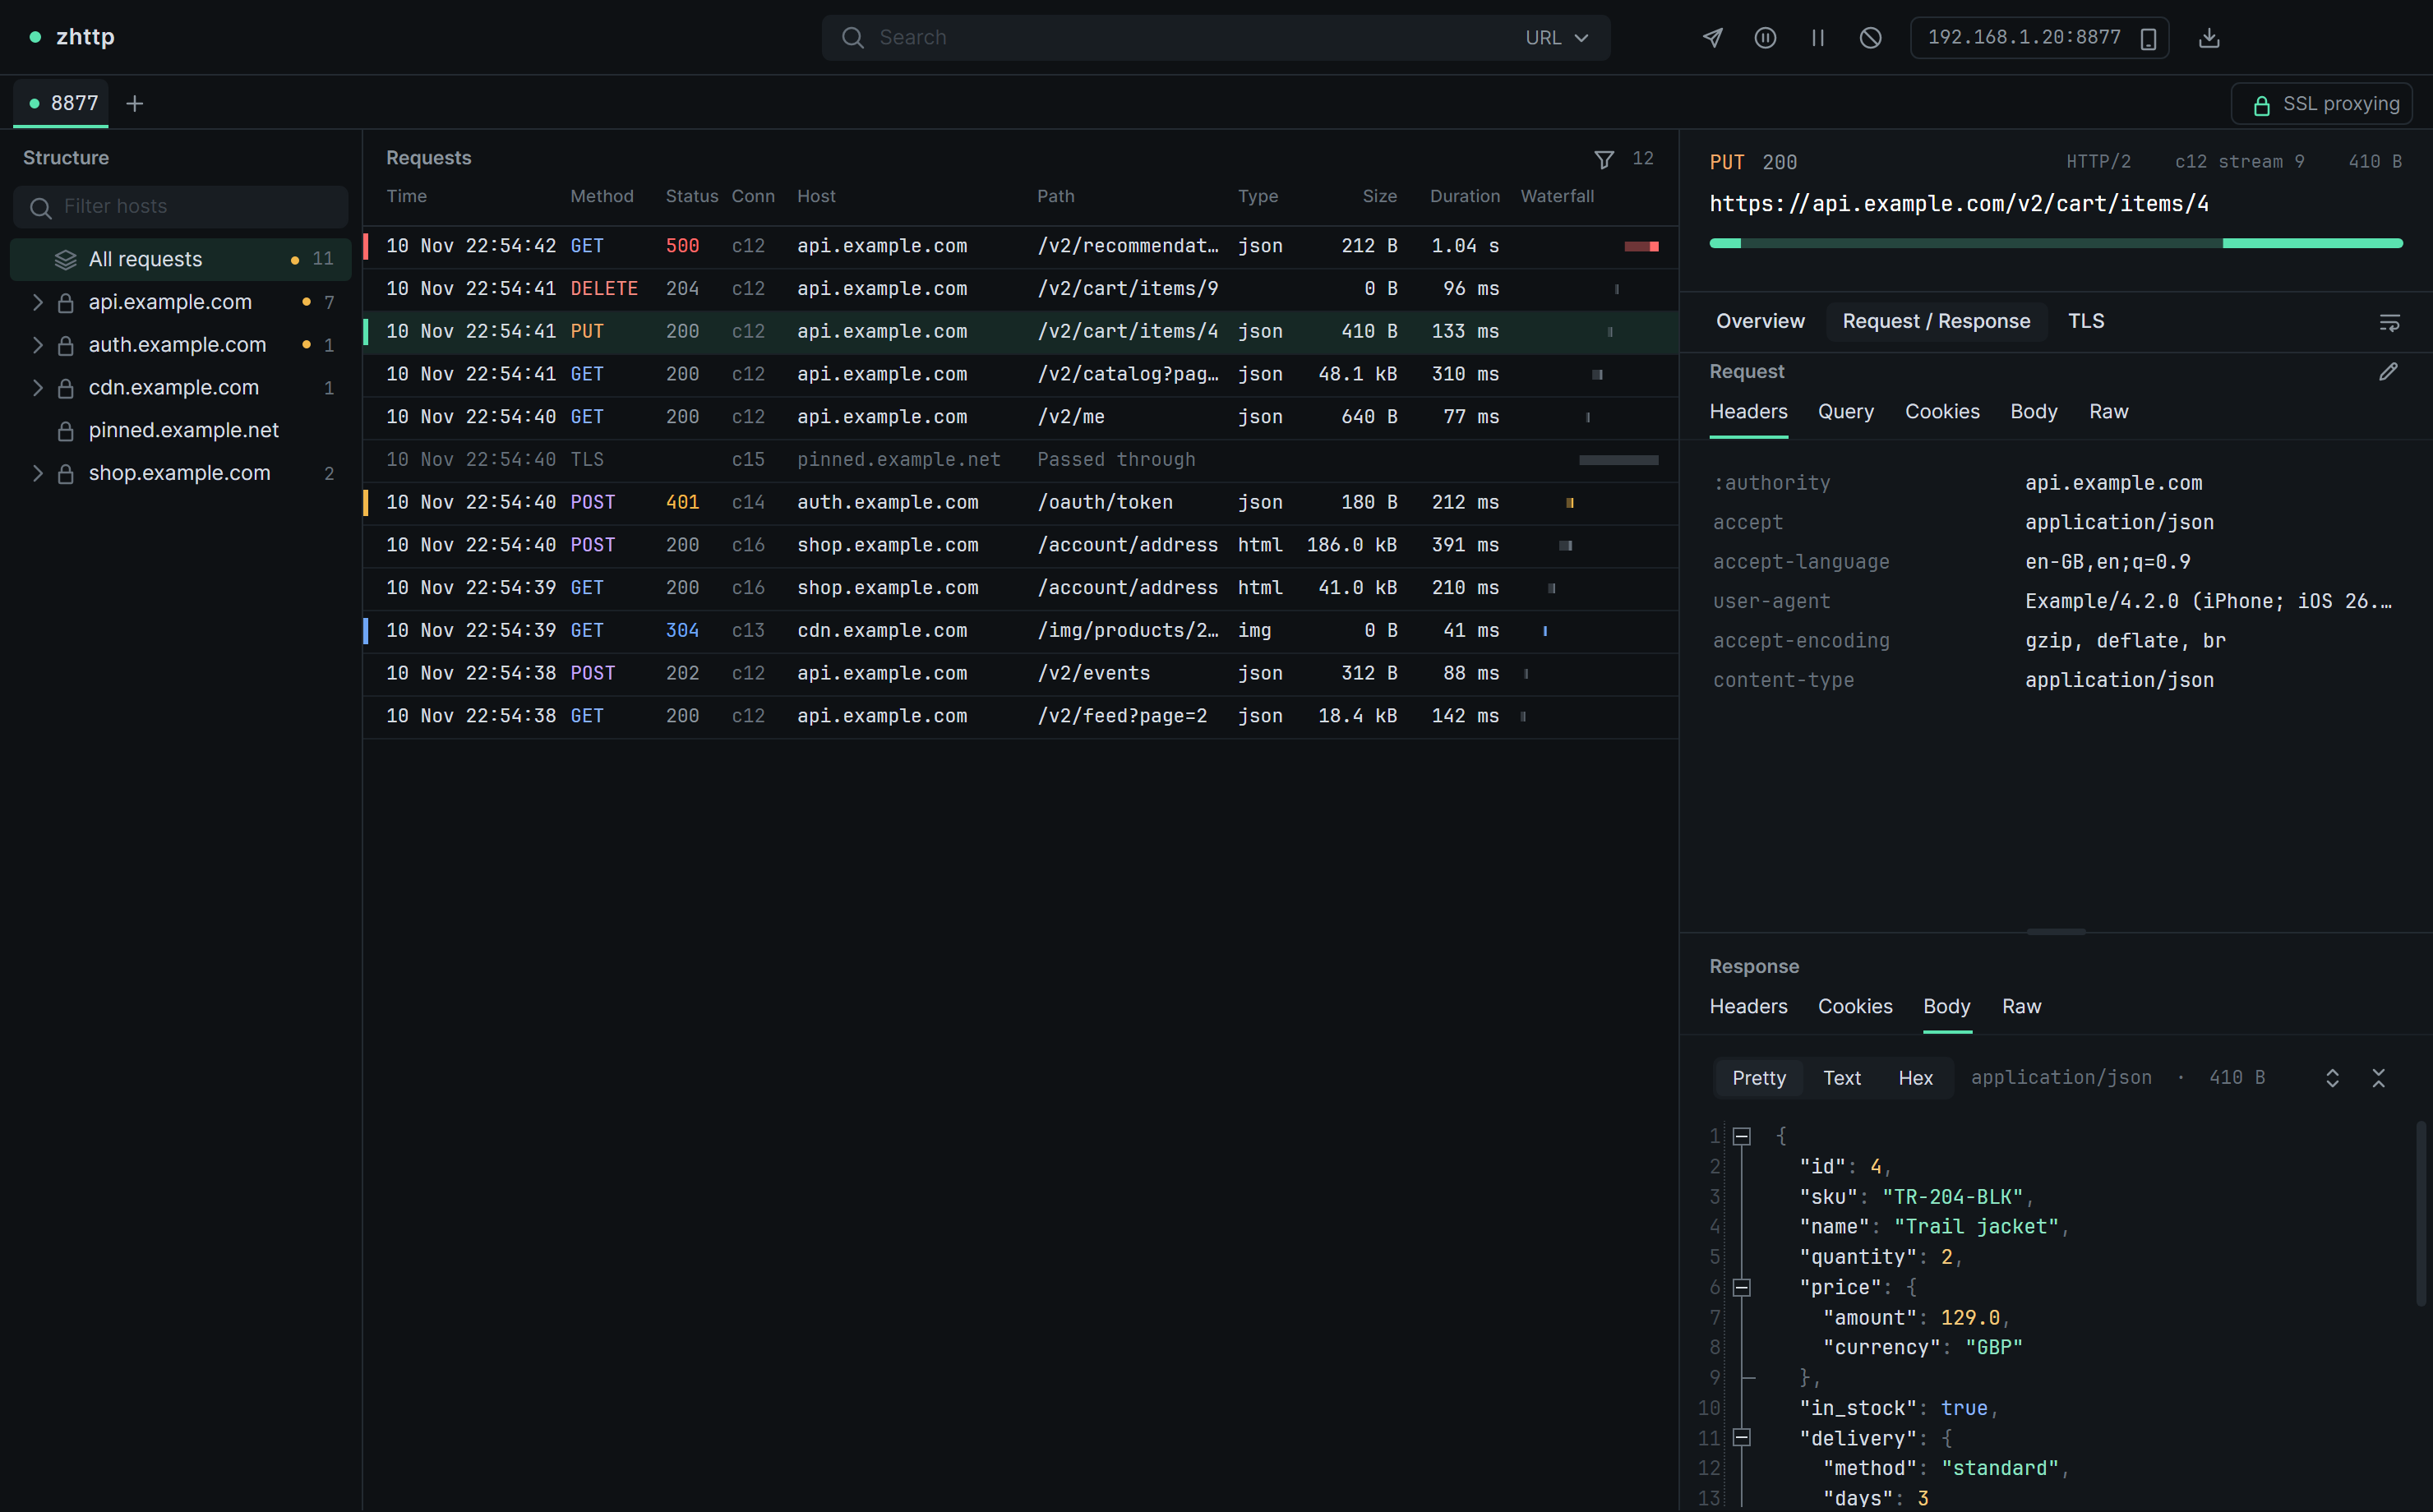
Top bar
Section titled “Top bar”| Control | What it does |
|---|---|
| Search | Filters the request list. Ctrl L jumps to it. See Search. |
| Composer | Opens the composer window, or brings it to the front. |
| Breakpoints | Opens or closes the breakpoints panel. A dot on it means something is held. |
| Scripts | Opens the Scripts window. |
| Smart actions | The lightning bolt. Opens the Smart actions window. |
| Pause / resume | Stops listing new traffic, or starts again. Devices keep working through the proxy while it’s paused. Ctrl P does the same. |
| Clear | Empties the session’s list and its drafts. It asks first; tick Don’t ask again for this session and it stops asking until zhttp restarts. |
| Address button | Shows how to connect a device. See Capture a device. |
| Open a recording | Opens a .zhttp, .har, Charles or powhttp file in a tab of its own. See Recordings. |
| Settings | Opens Settings. Ctrl , does the same. |
When an update has downloaded, Update to … appears beside the name at the top left. Click it to see what the update changes. It installs when zhttp closes, or straight away with Restart to update. The first time zhttp opens after an update, What’s new shows what changed since the version you had.
Session tabs
Section titled “Session tabs”Each tab is a session: one port, its own traffic. + starts another.
The buttons at the right end of the row set up the session on screen:
| Button | Sets |
|---|---|
| Block & allow | What the session refuses, and which hosts it captures. See Block and allow lists. |
| Network | A slower network for the session’s traffic. See Network conditions. |
| No caching | Makes the app fetch responses afresh instead of using copies it kept. See No caching. |
| Upstream | Another proxy to send the traffic on through. See Upstream proxy. |
| SSL proxying | Which hosts the session decrypts. See SSL proxying. |
| TCP | How the session’s connections to servers look, for example like an iPhone’s. See Fingerprints. |
| System proxy | Points this computer’s proxy settings at the session. See System proxy. |
Each shows what’s set after its name, for example Network 3G, SSL proxying 1 off or TCP iPhone. No caching and System proxy light up instead. A recording’s tab has none of them.
Structure
Section titled “Structure”Every host the session has seen, as a tree: host, then folders, then resources. All requests at the top shows everything.
- Click a host, folder or resource to list only the requests under it. Ctrl-click to choose several.
- Filter hosts narrows the tree. Esc clears it.
- The lock beside an HTTPS host turns its SSL proxying off or on. A crossed-out lock means the host is passed through without decryption.
- The number is how many requests are under each entry. An amber dot means some of them failed.
Right-click an entry to turn SSL proxying off for it, block it, add it to the allow list, add a breakpoint, map to file, map remote or script for everything under it, export it, or delete it (Delete). Deleting takes every request under the entry out of the session.
Once traffic arrives, Apps above the hosts lists what sent it, each expanding to the hosts it reached:
- A program on this computer shows under its name and icon, as Task Manager or Finder names it: Google Chrome, curl, Windows PowerShell. All of a browser’s processes count as one app.
- Another device, such as a phone using the proxy over Wi-Fi, shows under its IP address.
- Click an app to list only its requests. Ctrl-click to add more apps, or a host or folder: the list then shows the requests that are under both.
- Click Apps or Hosts to fold that part of the tree away.
A request zhttp sends again from the composer or an AI agent belongs to no app.
Requests
Section titled “Requests”One row per request, newest at the top.
| Column | Shows |
|---|---|
| Time | When the request started |
| Method | GET, POST and so on |
| Status | The response status, or ERR when the exchange failed |
| Conn | The connection it travelled on. Click it to follow the connection. |
| Host | Only while the list spans several hosts |
| Path | Path and query |
| Type | The response’s content type |
| Size | The response body’s size |
| Duration | From request to the response’s last byte |
| Waterfall | When it ran, against the rest of the list |
- The coloured stripe at a row’s left edge follows its status.
- A mark beside the stripe means zhttp sent the request itself, by replay, the composer or a smart action. It lights up on a request with an open draft, and turns amber while its response is held.
- A fainter row is a connection with no request to show: one passed through without decryption, or one whose TLS handshake failed.
- A speech bubble before the path marks a request you left a comment on. Point at it to read the comment.
- An A before the path marks the request picked to compare others with.
- The filter button above the list hides ERR rows, passed-through connections or both. It lights up while it hides anything.
- Select several rows with Ctrl-click or Shift-click, for example to export them.
Right-click a request for everything you can do with it: copy and save, follow its connection, replay, compose, check its fingerprint or export it as a TLS profile, compare it, add a breakpoint, a map or a script, export it, highlight it, comment on it, make it a favourite or delete it.
Favourites, highlights and deleting
Section titled “Favourites, highlights and deleting”- Favourites: point at a row and click the star at its left edge, or press Ctrl D with rows selected. The star button above the list lists only favourites.
- Highlight: right-click › Highlight › a colour tints the selected rows. None takes it off.
- Delete: Delete (Cmd Backspace on a Mac) or right-click › Delete takes the selected requests out of the session, with their drafts and comments.
Favourites, highlights and comments are kept with the session’s traffic.
Quick filters
Section titled “Quick filters”The chips above the columns list only the requests of the kinds you pick. Click a chip to turn it on or off. All turns every chip off.
| Group | Chips | A request matches when |
|---|---|---|
| Protocol | HTTP, HTTPS, WebSocket | It went over plain HTTP or over TLS, or it became a WebSocket. A WebSocket matches only WebSocket; a connection passed through matches HTTPS. |
| Content | JSON, Form, XML, JS, CSS, HTML, Image, Media, Font, Other | The request’s or the response’s Content-Type is of that kind. Other is any other type, or none. |
| Status | 1xx, 2xx, 3xx, 4xx, 5xx | The response’s status is in that class. |
- Chips in one group add to each other: JSON and HTML list both. Chips in different groups narrow each other: JSON and 4xx list the JSON requests that got a 4xx.
- They work together with the search, the entries chosen in Structure, favourites and the filter button. The count above the list reads, for example,
8 of 16. - A request still waiting for its response, or one that failed, matches no status chip. It comes into the list when a response of a chosen class arrives.
- Each session has its own chips, and they are all off when zhttp starts.
- When the list is too narrow for every chip, the Status chips and then the Content chips fold into one dropdown each. Click it to turn its chips on or off. It is tinted while any of them is on.
Following a connection
Section titled “Following a connection”Following a connection lists only the requests that went over it. Over HTTP/2 these are its streams, so you see every request an app sent on one connection.
- To follow a request’s connection, select it and press F, click its Conn cell, right-click it › Follow connection c12, or click the entry ID (
12.5) at the top of the inspector. The command palette offers it too. - While you follow one, a
c12chip leads the quick filters, the Conn column shows each request’s stream ID, and the Waterfall spans the connection’s lifetime, from opening to closing. Requests sent at the same time over HTTP/2 overlap. - The search, quick filters, favourites and the filter button still apply. The entries chosen in Structure don’t, because one HTTP/2 connection can carry requests for several hosts.
- To see every request again, click the cross on the chip or press Esc in the list.
Inspector
Section titled “Inspector”The selected request: its method and status, the URL, your comment on it, and a bar of timing phases. The inspector sits beside the list of requests; to have it under the structure and the list, across the whole window, turn on Show the inspector under the requests under Settings → General.
To comment on a request, type on the Comment line under the URL, or right-click the request › Comment… Enter or clicking elsewhere keeps the comment; Esc drops what you typed. Clear the text to take the comment off. Comments are kept with the session’s traffic and saved in recordings.
The timing bar splits the request’s time into phases. The Timing tab lists how long each took:
| Phase | Time spent |
|---|---|
| dns | Looking up the server’s name |
| connect | Opening the TCP connection |
| tls | The TLS handshake with the server |
| sent | Sending the request |
| waiting | Waiting for the first byte of the response |
| download | Receiving the rest of the response |
Only the first request on a connection waited for it to be set up. Later ones read reused for dns, connect and tls. Through an upstream proxy, dns and connect are for reaching the proxy and opening its tunnel. A HAR from another tool has no connection timing, so those three show —.
The entry ID at the top, such as 12.5, is the connection and the stream. Click it to follow the connection.
The tabs:
-
Overview: URL, method, protocol and body size of the request; status, content type and size of the response; the connection, including whether the host was decrypted.
-
Request / Response: both messages, one above the other, or side by side with Show the request and response side by side under Settings → General. Each has Headers, Cookies and Body tabs. The request also has Query, and a urlencoded or multipart body gets a Form tab. Raw shows the whole message: HTTP/1 exactly as sent, HTTP/2 as its fields in the order they went. The compose button beside Request opens it in the composer.
-
Messages: only for a WebSocket or an event stream (
text/event-stream). Its messages, as they arrive, with All, Sent and Received to pick a direction. See WebSockets. -
TLS: the handshake. See Fingerprints.
-
Timing: each phase’s time, when the request started and its total, and the connection it went on: whether it was reused, and the server’s address.
-
Connection: every request on the connection, by stream ID, on one timeline from the connection’s opening to its closing. Over HTTP/2, overlapping bars are requests in flight at the same time. Click one to show it. A request the list leaves out makes the list follow the connection. Below the timeline:
- when the connection opened and closed, how long it lasted, and the bytes sent each way
- the upstream proxy it went through, if there was one: its type, host, port, user and password, and Full, all four as one
host:port:user:passline. Right-click it › Copy value to copy it. - how it was set up: the name lookup, the connection, and the TLS version and ALPN negotiated with the server and with the client
- the client’s opening HTTP/2 frames: its SETTINGS, the connection’s WINDOW_UPDATE, any PRIORITY frames and the order of its pseudo-headers
- anything the engine reported about the connection, such as a GOAWAY with its error code and last stream
A stream reset before its response completed shows on its row as ERR, with the reason.
Headers are listed in the order and spelling the app sent them. Right-click a header, query parameter or cookie to copy it, copy its value, or decode it. A JWT chip beside a value that holds a JSON Web Token opens the token decoded.
Bodies
Section titled “Bodies”Bodies show with their Content-Encoding (gzip, br, zstd, deflate) removed. The bar above a body gives its content type and size. A tag such as gzip says how it travelled; point at the tag for its size compressed.
| View | Shows |
|---|---|
| Pretty | JSON indented, with folding; HTML and XML laid out a tag to a line; MessagePack written out as JSON; images and SVG drawn, over a checkerboard; protobuf decoded |
| Tree | JSON, JSON lines, MessagePack and decoded protobuf as rows of key, value and type that open and close. Right-click a row to copy its value or its path ($.items[3].sku; a protobuf field as order.items.sku) |
| Text | The body as text |
| Hex | The bytes |
A body sent as application/msgpack reads as MessagePack on its own. A body with no content type, or application/octet-stream, gets Decode as protobuf and Decode as MessagePack buttons. Either choice is remembered for that endpoint. The MessagePack tag’s × shows the body as it is again.
A very long token, such as a base64 string, shows its first characters and a chip with the size of the rest. Copying and searching still see all of it. Select text in a body and right-click › Decode to decode it.
An SVG is drawn when its type is image/svg+xml, or when its type says nothing more than binary, XML or text and its first element is <svg>. Drawing it loads nothing it links to, such as remote images, fonts or stylesheets. An SVG that does not draw shows its source, with the reason above it.
In Tree, an object or array shows its size, {7} or [240]. One with more than 100 values opens in ranges, such as [0 … 99], so no level shows more than 100 rows. The buttons at the top right open everything, stopping at about 5,000 rows, and close everything. Drag the edges in the Key / Value / Type header to resize the columns. Click a value’s row to see the whole value under the tree, with its path; a very long one shows a chip there as Pretty does, and you can select, copy or decode any of it. Drag the line above it to make it taller.
A body over 64 MB shows a part at a time, with buttons for the previous and next part. The wrap button at the top right of the inspector wraps long lines.
Messages
Section titled “Messages”When you save or export something, or something goes wrong, a message appears at the bottom right of the window. Smart actions that notify you show theirs there too.
- A saved file’s message names the file. Show in folder (Show in Finder on a Mac) opens its folder with the file selected.
- A message goes after a few seconds. It waits while you point at it, and while zhttp is in the background.
- An error stays until you close it with ×.
- Up to three show at once, the newest at the bottom.
zhttp is light or dark as your computer is, and switches when the computer does. To keep one, pick Light or Dark beside Theme under Settings → General. System follows the computer again.